ARFBench: Time-Series Models Have to Answer Questions Now
ARFBench turns observability telemetry into multiple-choice anomaly reasoning questions, exposing a new gap between forecasting accuracy and time-series question answering.
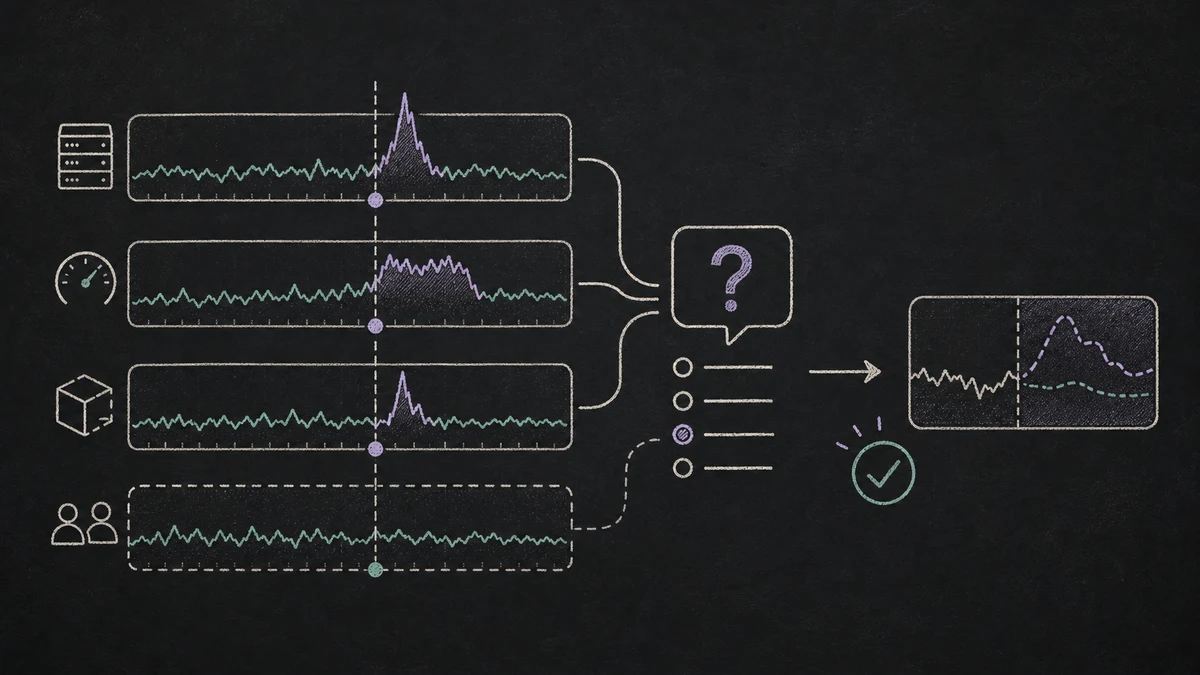
Most time-series benchmarks ask a model to forecast the next values. ARFBench asks something closer to what engineers ask during an incident: is there an anomaly, when did it start, which channel moved, how large was it, and did this metric lead or lag another one?
That is a different benchmark shape. A model can be good at forecasting observability data and still be weak at answering language-grounded questions about the plotted telemetry. Conversely, a vision-language model can read a chart and follow a multiple-choice prompt without having a native time-series representation. ARFBench, from Datadog and collaborators at CMU, is interesting because it puts those worlds in the same evaluation.
The benchmark is public on Hugging Face Datasets, the leaderboard exposes CSV result files, and Datadog has released Toto-1.0-QA-Experimental, a multimodal checkpoint built from Toto and Qwen3-VL. The caveat is that this is not a drop-in extension of a normal forecasting leaderboard. ARFBench belongs in the hosted benchmark visualizer, but as a separate reasoning benchmark, not as another row in the forecast-accuracy stack.
#What ARFBench Measures
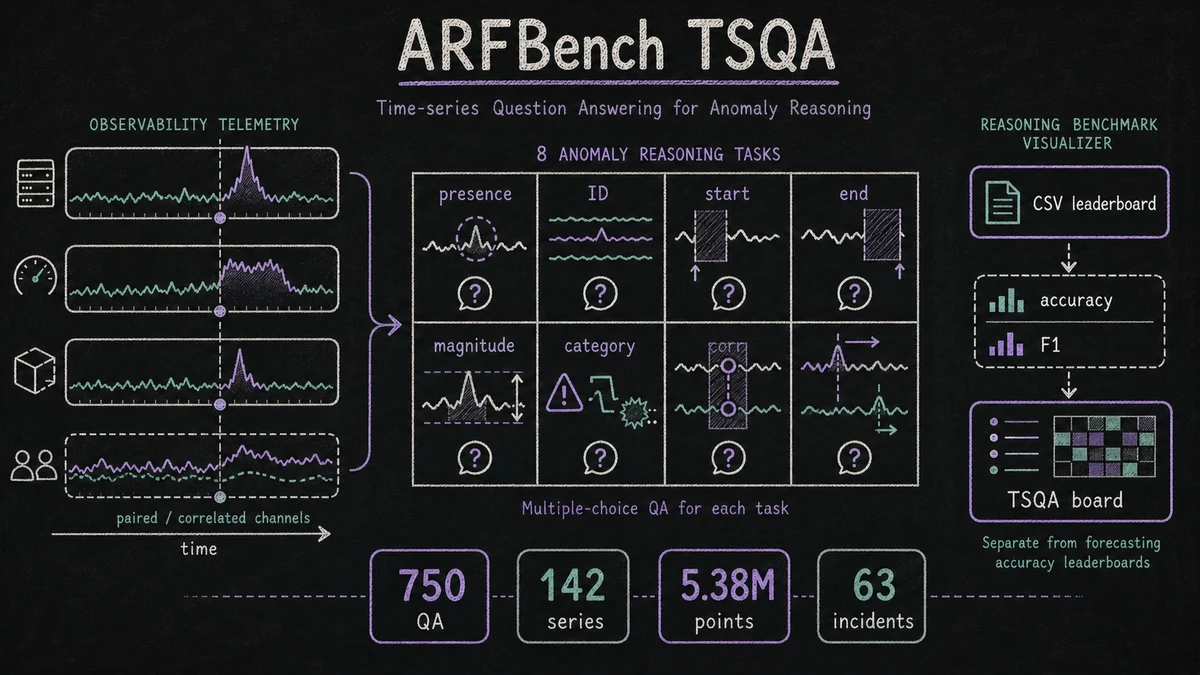
ARFBench stands for Anomaly Reasoning Framework Benchmark. It contains 750 multiple-choice QA pairs built from 142 observability time series, 5.38 million data points, and 63 Datadog production incidents. The authors state that the metrics were generated from internal monitoring and do not include customer data.
Each question combines three inputs:
| Input | Why it matters |
|---|---|
| A templated question | Defines the exact anomaly-reasoning task |
| A caption or description | Explains what the metric or grouped channels represent |
| Time-series data and plots | Provides the signal evidence the model must inspect |
This design matters because observability anomalies are contextual. A spike in unauthorized access attempts and a spike in latency may have similar shapes but different operational meaning. A single variate can also look normal in isolation but anomalous in a multivariate group. ARFBench forces the model to use both the signal and the surrounding context.
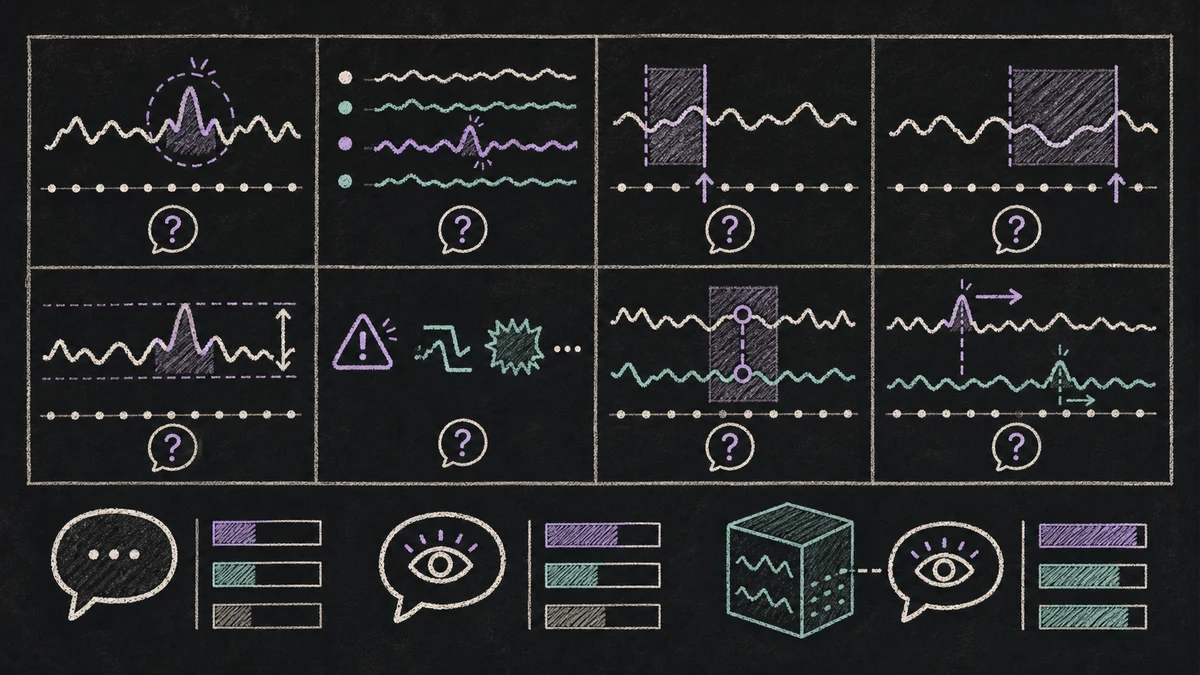
The benchmark has eight question categories grouped into three difficulty tiers:
| Tier | Categories | What the model must do |
|---|---|---|
| Tier I | Presence | Decide whether an anomaly exists |
| Tier II | Identification, Start Time, End Time, Magnitude, Categorization | Characterize one time series or multivariate group |
| Tier III | Correlation, Leading/Lagging Indicator | Compare anomaly structure across paired time series |
That last tier is the most distinctive. Forecast benchmarks usually score each target against future values. ARFBench asks whether two telemetry traces are related and whether one appears to lead the other. That is much closer to incident triage and root-cause analysis than a standard next-window forecast.
#Why This Is Not Just Anomaly Detection
It would be easy to file ARFBench under anomaly detection, but that undersells it.
Classical anomaly benchmarks usually ask for point labels, segment labels, or anomaly scores. ARFBench turns anomaly understanding into a multiple-choice reasoning problem. The model is not only asked to say "anomaly." It may need to select a start boundary, identify an anomalous channel, compare two series, or choose a semantic anomaly category.
This sidesteps some of the ground-truth problems that make anomaly detection evaluation messy. If one model predicts a start time ten minutes early and another predicts it ten minutes late, scoring segment overlap can become arbitrary. ARFBench instead constructs answer choices with a single correct option relative to the available choices. That does not make the benchmark perfect, but it makes the evaluation closer to a decision an operator might actually make.
It also makes ARFBench complementary to BOOM. BOOM asks whether a model can produce calibrated forecasts for production telemetry. ARFBench asks whether a model can reason about anomalies in production telemetry. The inputs overlap, but the evaluation target is different.
#How the Dataset Was Built
The authors start from real incident timelines: the discussion, triage, and telemetry artifacts engineers used while resolving production issues. They extract relevant time series, anonymize and summarize metric-query context, generate plots, and create candidate questions from templates.
An oracle VLM is used in the generation and filtering pipeline, but the paper is explicit that humans reviewed and corrected the resulting QA pairs to ensure accuracy and remove sensitive information. The final benchmark is derived from incidents resolved between March 7, 2025 and March 30, 2025. A separate temporally disjoint set of real incidents, plus synthetic data, is used for post-training the experimental model.
That construction has two implications:
| Implication | Why it matters |
|---|---|
| The data is realistic | The time series come from production observability, not synthetic waves |
| The benchmark is narrow | It is focused on software incident response, not every TSQA domain |
The narrowness is a feature if your use case is observability, SRE automation, or incident copilots. It is a limitation if you want a general benchmark for medical, financial, industrial, or retail time-series question answering.
#What the Results Say
The released leaderboard ranks models by accuracy and macro-F1. Macro-F1 matters here because label imbalance can make accuracy misleading; the per-category frequent-choice baseline reaches 45.1% accuracy but only 17.3% F1.
The top of the released leaderboard looks like this:
| Model or baseline | Type | Accuracy | Overall F1 |
|---|---|---|---|
| Model-Expert Oracle | Baseline | 87.2 | 82.8 |
| Domain Experts | Baseline | 72.7 | 64.6 |
| Non-domain Experts | Baseline | 69.7 | 60.7 |
| Toto-1.0-QA-Experimental 32B | Post-trained TSFM/VLM | 63.9 | 48.9 |
| GPT-5 | VLM | 62.7 | 51.9 |
| GPT-5.4 | VLM | 61.3 | 51.4 |
| Gemini 3 Pro | VLM | 58.1 | 49.6 |
| Qwen3-VL 32B post-trained | Post-trained VLM | 56.9 | 46.6 |
There are three takeaways.
First, frontier VLMs are much stronger than text-only LLMs and older baselines. The plot is part of the task, not decoration. The paper's ablations support this: removing time-series plots knocks GPT-5 far down, while giving both the plot and caption produces the best GPT-5 result.
Second, the specialized Toto-QA model is competitive with frontier VLMs despite being an experimental release. It posts the highest model accuracy in the released CSV, while GPT-5 leads on overall F1 among the evaluated models. That distinction is important: this is not a clean "one model wins everything" result.
Third, humans and models make different mistakes. Domain experts outperform all individual models, but the model-expert oracle is much higher than either alone. The paper defines this oracle as a best-of-two selector over a model answer and an expert answer. It is not a deployable model, but it is a useful ceiling: the future interface may be human-plus-model, not model-replaces-human.
#Why TSFMs Need This Kind of Benchmark
Time-series foundation models are usually evaluated on numeric outputs: MASE, CRPS, WQL, sMAPE, Skill Score, and so on. Those metrics are necessary, but they do not test whether a model can participate in operational reasoning.
An incident responder does not only need a forecast distribution. They need answers to questions like:
| Operator question | Forecast metric equivalent? |
|---|---|
| Did the anomaly start before or after the deploy? | No direct equivalent |
| Which shard, region, or service channel moved first? | Requires multivariate reasoning |
| Are two spikes likely related? | Requires cross-series comparison |
| Is this a sustained level shift or an isolated spike? | Requires semantic classification |
ARFBench makes those questions measurable. That is valuable even for teams that never use the Datadog dataset directly, because it highlights a missing layer in the TSFM stack: forecast models need to become interpretable tools inside broader decision workflows.
This connects to a larger trend we covered in TFRBench: time-series reasoning is becoming its own benchmark axis. The difference is that TFRBench emphasizes forecasting reasoning, while ARFBench emphasizes anomaly reasoning over observability telemetry.
#Should TSFM.ai Add ARFBench to the Hosted Benchmark Visualizer?
Yes, with one architectural constraint: ARFBench should be a dedicated reasoning / TSQA benchmark page, not merged into the standard forecasting leaderboards.
The public artifacts are sufficient for a static hosted visualizer integration:
| Artifact | Status |
|---|---|
| Dataset | Public on Hugging Face, Apache-2.0 |
| Leaderboard Space | Public on Hugging Face, Apache-2.0 |
| Overall leaderboard CSV | Public |
| Per-category accuracy CSV | Public |
| Per-category F1 CSV | Public |
| Experimental checkpoint | Public: Datadog/Toto-1.0-QA-Experimental |
| GitHub repository | Linked from the dataset card, but currently returns 404 |
The existing TSFM.ai benchmark loader already handles remote CSV leaderboards for FEV Bench, GIFT-Eval, and BOOM. ARFBench could be added with a loader that reads:
https://huggingface.co/spaces/Datadog/ARFBench/resolve/main/results/ARFBench_leaderboard.csv
https://huggingface.co/spaces/Datadog/ARFBench/resolve/main/results/ARFBench_leaderboard_category_accuracy.csv
https://huggingface.co/spaces/Datadog/ARFBench/resolve/main/results/ARFBench_leaderboard_category_f1.csv
For a first version, the page should show model, model type, accuracy, overall F1, tier-level accuracy, and tier-level F1. A better version would add category filters for Presence, Identification, Start Time, End Time, Magnitude, Categorization, Correlation, and Indicator.
The bigger decision is naming and placement. ARFBench should not be presented as "which forecasting model is best?" It answers: which multimodal model can reason over observability anomalies? That is a different leaderboard contract.
#Hosted Model Feasibility
The Toto-QA checkpoint changes the feasibility story. Unlike paper-only releases, there is a public model artifact we can inspect and potentially host. The model card lists it as Apache-2.0, built from Qwen/Qwen3-VL-32B-Instruct and Datadog/Toto-Open-Base-1.0, with image-text-to-text and visual-question-answering tags.
That makes it feasible, but not cheap. This is a 32B-class multimodal model with time-series modules, not a lightweight TSFM endpoint. Hosting it would require a separate serving path from ordinary forecast models because the input contract is different: image or plotted time series, text prompt, answer choices, and possibly encoded time-series modules.
The practical sequence should be:
- Add ARFBench to the benchmark visualizer as a static, CSV-backed leaderboard.
- Add a hosted-model overlay for
Datadog/Toto-1.0-QA-Experimentalonly after confirming inference packaging and GPU requirements. - Keep live reruns out of scope until there is a stable evaluation harness we can run reproducibly.
That gives users immediate benchmark visibility without implying we can already run the full TSQA evaluation loop on demand.
#The Bottom Line
ARFBench is one of the clearest signals that time-series evaluation is moving beyond "predict the next window." It tests whether models can read telemetry, use context, answer structured questions, and compare related series during software incidents.
The benchmark also exposes the current gap. Frontier VLMs and specialized TSFM-VLMs are useful, but they are still below domain experts. The strongest result in the paper is not that one model wins; it is that models and experts appear complementary. For incident response, that is exactly the right framing. A useful system should not only forecast. It should help an operator ask better questions, inspect the right traces, and make fewer reasoning mistakes under pressure.
Primary sources: ARFBench paper (arXiv:2604.21199) · CMU ML Blog post · ARFBench dataset · ARFBench leaderboard · Toto-1.0-QA-Experimental checkpoint