ForecastOps: Local-First Observability for Production Forecasts
You can stand up a time-series foundation model in an afternoon. Knowing whether its forecasts are any good in production is the harder half. ForecastOps is an open-source, local-first layer that captures every forecast, scores it, and gives you a UI — add one line after .predict().
Getting a forecast out of a time series foundation model has never been easier. Point Chronos-2, Toto, or any hosted TSFM.ai model at a history window, ask for a horizon, and you get back predictions and intervals in zero shot. The model is the easy part.
The hard part starts the moment that forecast goes into production. Is it actually beating the naive baseline you replaced? Which series are dragging the average down? Does accuracy fall off a cliff past day seven, or hold? Are your 90% intervals actually covering 90% of outcomes, or did the last model bump quietly break calibration? When you ship a new model version, did anything regress — and would you notice before a stakeholder does?
Most teams answer these questions with a graveyard of one-off notebooks, a spreadsheet of MAEs, and a vague memory of what "good" looked like last month. ForecastOps is the alternative: an open-source, local-first observability and evaluation layer that turns every forecast you produce into a tracked, scored, browsable run — without a cloud account, a warehouse, or a single change to how your model runs.
This post is a hands-on tour. Every screenshot below is the real ForecastOps UI running on a worked example, and every number is computed by ForecastOps on that data.
#The one line that starts it
ForecastOps is built by Parisi Labs and ships on PyPI under Apache-2.0:
pip install forecastops
It works with the forecasting code you already have. You produce a forecast however you like — a hosted TSFM.ai call, a local Chronos or Moirai checkout, Prophet, a gradient-boosted baseline — and then you hand the result to capture:
import forecastops as fops

# Your existing code. `forecast` is whatever your model returns.
forecast = model.predict(future)

run = fops.capture(
    forecast,
    project="site-traffic",
    series_id="homepage",
    cutoff=history["ds"].max(),
    actuals=actuals_df,          # optional now; attach later when truth lands
)
print(run.run_id, run.status)
That's the whole integration. capture normalizes the forecast, validates it, computes horizon-aware metrics, writes a Parquet artifact plus a row of metadata to a local DuckDB store, and returns a run handle. No network calls leave your machine.
If you'd rather not touch the call site at all, decorate the function that produces the forecast and ForecastOps captures the return value as a side effect, passing the output through unchanged:
@fops.forecast(project="site-traffic", model_name="chronos-2")
def predict_traffic(history):
    return tsfm.forecast(history, model="chronos-2", horizon=28)
What ForecastOps deliberately does not do is just as important: it does not train or host models, it does not require a cloud account, and it does not phone home. It is the evaluation and observability layer that sits next to your model, wherever that model runs.
#A worked example: demand forecasting with Chronos-2
To make the rest concrete, we'll follow one realistic project. A retailer forecasts daily demand for five regional distribution centers (north, south, east, west, central) with a hosted Chronos-2 model, 28 days out, with 90% prediction intervals. They keep a seasonal-naive forecast — "repeat last week" — as the benchmark to beat. The dataset here is synthetic so you can reproduce it, but everything ForecastOps reports about it is real.
Most production forecasts aren't a single series — they're a panel. ForecastSchema maps your dataframe's columns onto the canonical semantics ForecastOps understands, so you never have to rename anything:
import forecastops as fops

schema = fops.ForecastSchema(
    series_id="series_id",
    target_time="target_time",
    prediction="prediction",
    lower="yhat_lower",
    upper="yhat_upper",
    extra_columns=["region", "regime"],   # kept so you can slice error by them later
)

run = fops.capture(
    forecast_df,                  # one row per (series_id, target_time)
    project="retail-demand",
    schema=schema,
    cutoff=cutoff,
    actuals=actuals_df,           # series_id, target_time, actual
    benchmark=seasonal_naive_df,  # series_id, target_time, yhat
    benchmark_name="seasonal-naive",
    model_name="chronos-2",
    model_version="2026.05",
)
The extra_columns are the quiet hero here. Any categorical column you keep — region, store format, holiday flag, weather regime, event type — becomes a slice you can break error down by, automatically. We'll see that pay off in a moment.
ForecastOps also speaks the dialects of the libraries you probably already use. Adapters ship for Prophet, Nixtla / statsforecast, Darts, and GluonTS, plus plain dataframes and NumPy arrays, so for those you can often skip the schema entirely and let ForecastOps detect the format.
#Open the UI
Capture a few forecasts, then launch the local explorer:
fops report --latest   # optional: a static, shareable HTML report for one run
fops ui                # the full explorer at http://127.0.0.1:4784
fops ui opens a read-only window onto your local store. The landing view is every run you've captured, sortable and filterable, with the headline metrics inline — horizon, point count, MAE, WAPE, bias, interval coverage, skill versus the benchmark, and validation status.
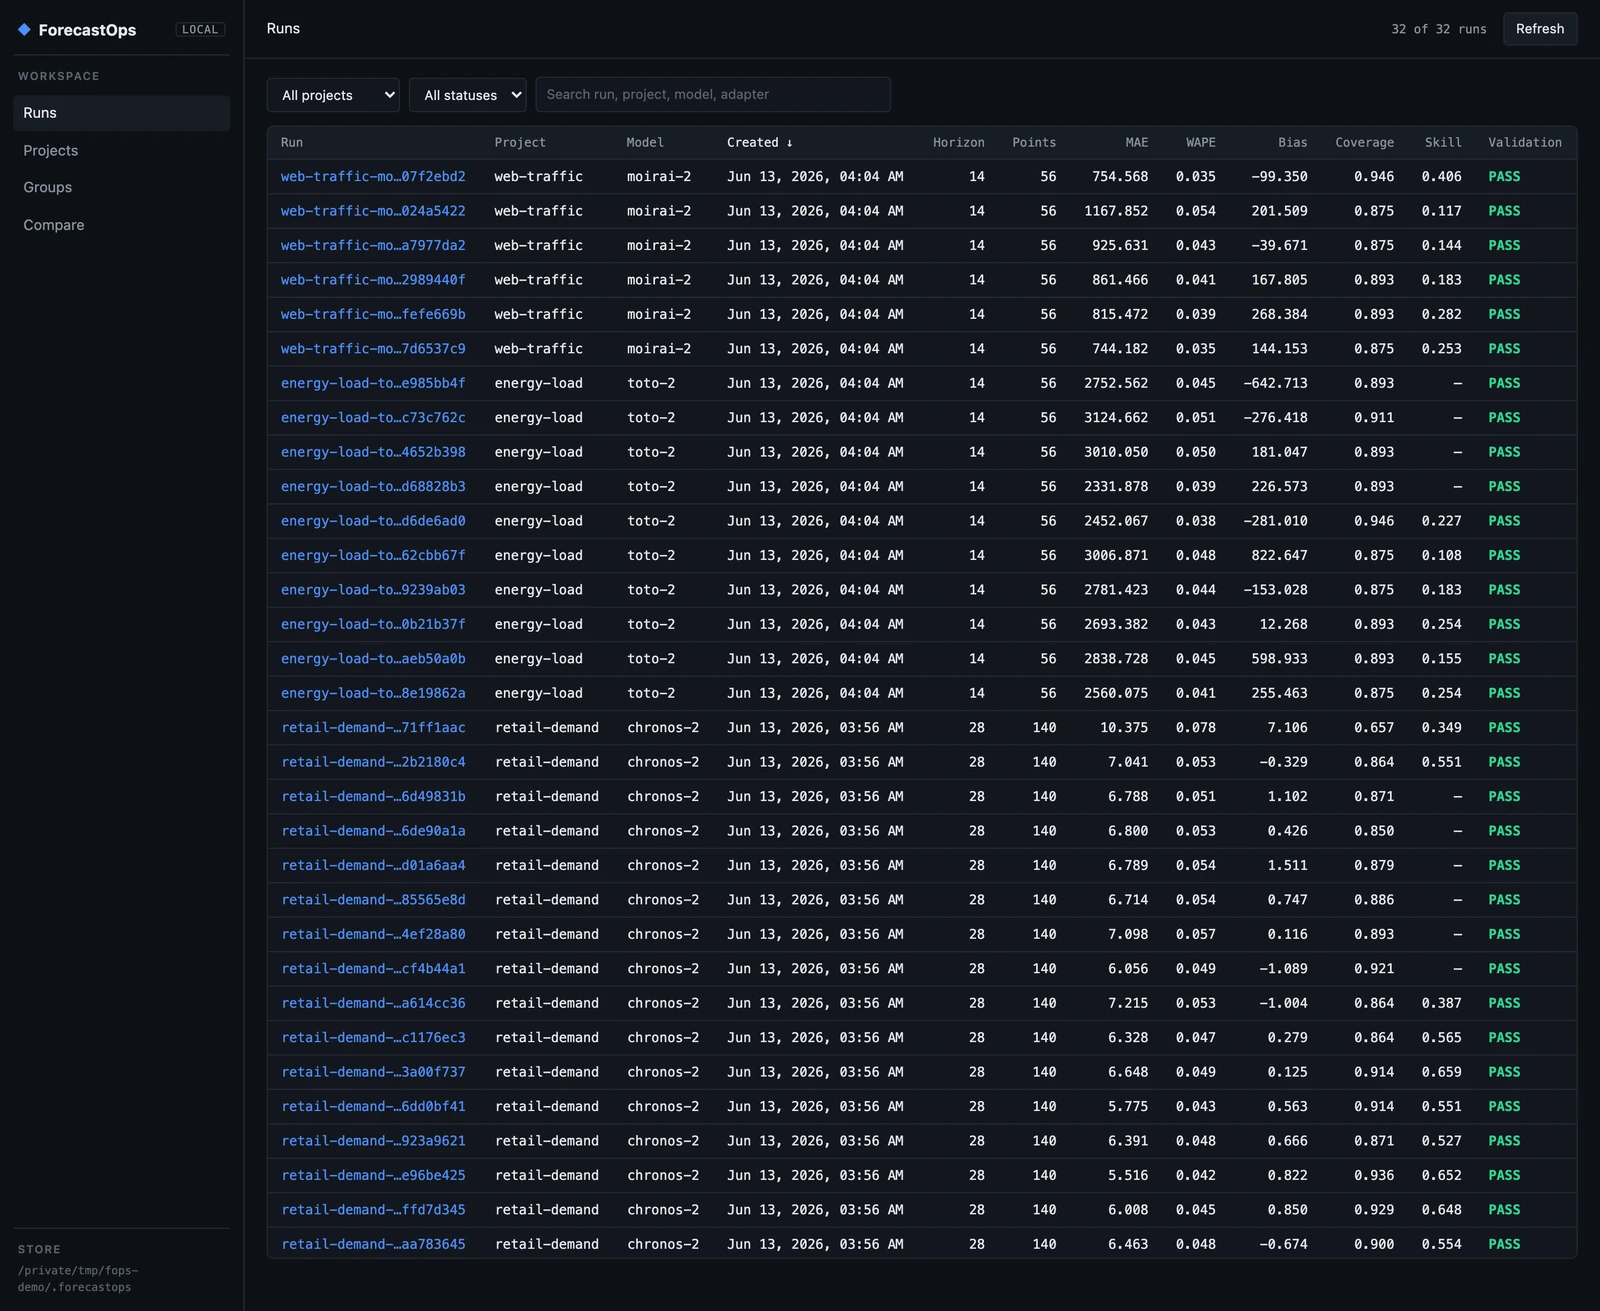
This is already more than most teams have: a single place where the demand model, an energy-load model on Toto-2, and a web-traffic model on Moirai-2 all live side by side, each row a forecast you can trust was scored the same way.
#Read a single run
Click any run and you get the full story of one forecast. The header carries the headline metrics — for our base Chronos-2 run, MAE 7.04, WAPE 5.3%, bias −0.33, and 90% interval coverage of 86%. Below that, a forecast inspector draws one chart per series: prediction, actuals, the benchmark, and the interval band, so you can see where the model tracked and where it drifted. On the right, the run card and a capture trace timeline record exactly how the forecast was processed — adapter detection, normalization, validation, artifact write, benchmark comparison — each step timed.
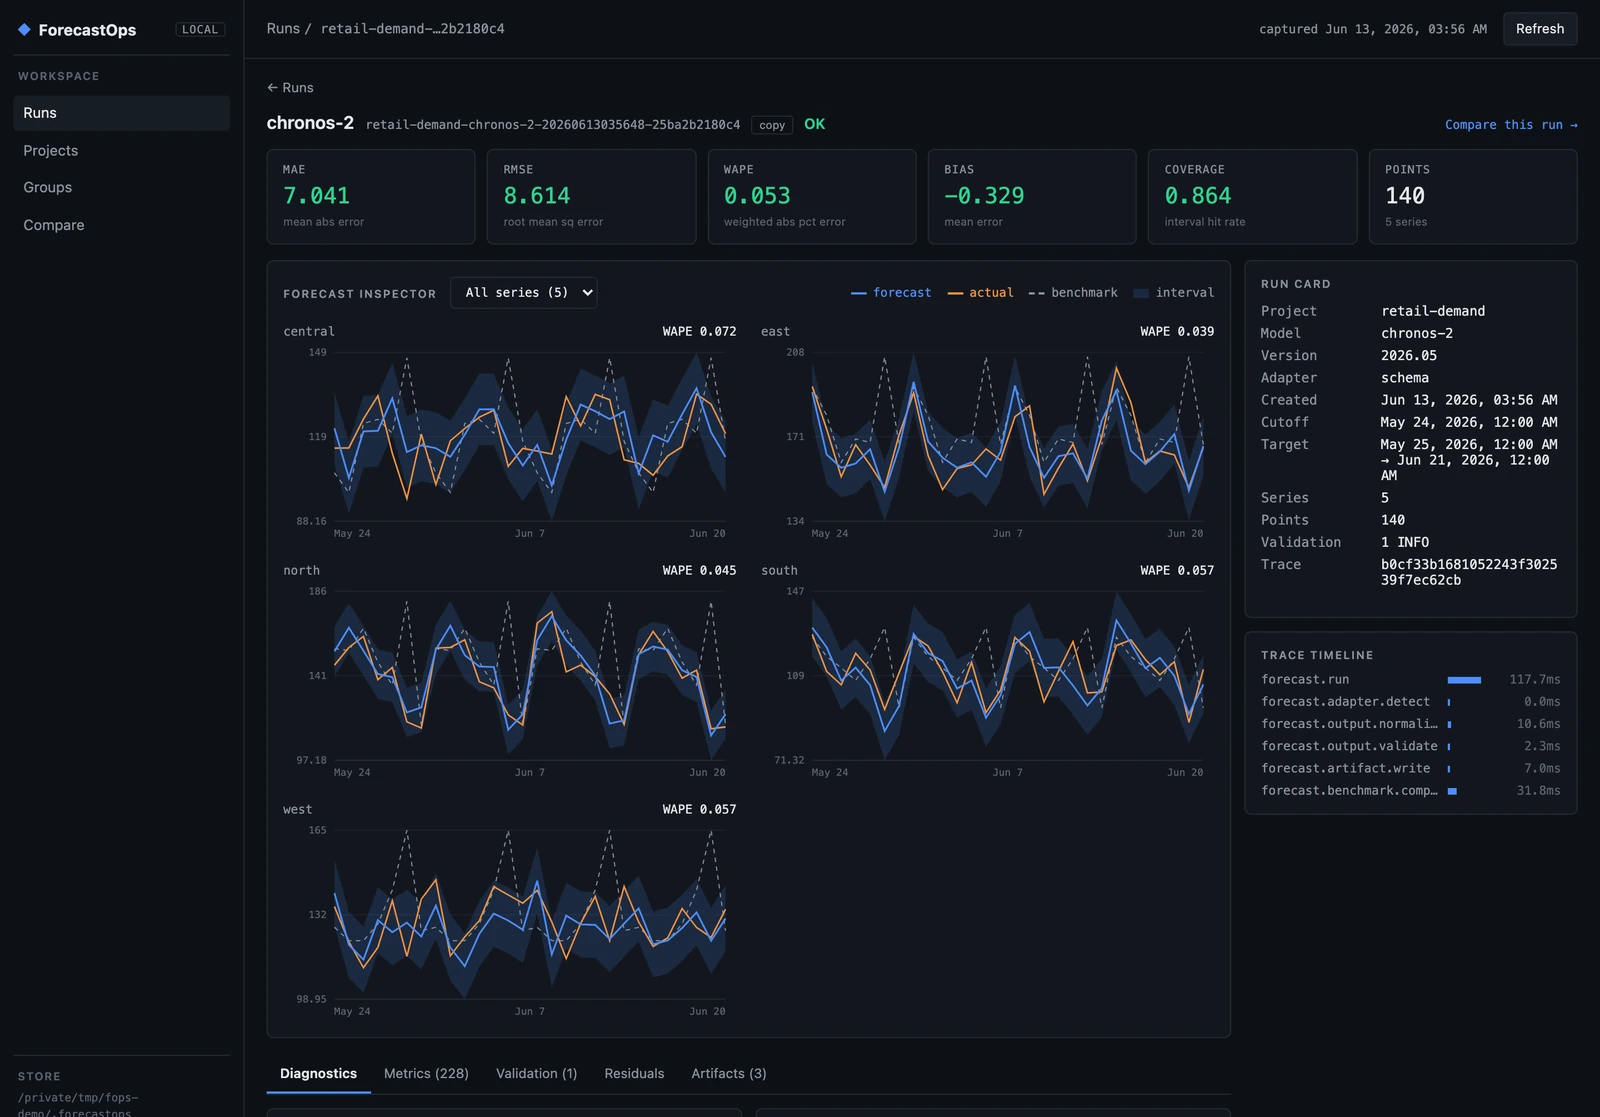
That trace timeline is OpenTelemetry-shaped under the hood. Locally it's a readable record of what happened; wire up an OTel collector and the same spans flow into your observability stack — without ever emitting raw forecast points.
#Validation catches the silent failures
Before any metric is computed, ForecastOps validates the forecast. It looks for the failure modes that quietly corrupt evaluations: schema gaps, timezone-naive timestamps, duplicate (series, target_time) rows, malformed intervals where the lower bound sits above the upper, and — most importantly — leakage, where a "forecast" timestamp lands at or before its own cutoff. Every run carries a validation status (you can see the green PASS column in the Runs view), and you can lint a forecast file before you ever capture it:
fops lint forecast.parquet --schema schema.yaml
WARN timezone_naive: cutoff_time or target_time is timezone-naive; timezone-aware timestamps are safer
Leakage in particular is the bug that makes a model look brilliant in backtests and mediocre in production. Catching it at capture time, every time, is worth the import on its own.
#Slice the error until it confesses
A single MAE tells you almost nothing about why a forecast is good or bad. Because we kept region and regime as extra_columns, ForecastOps automatically computed metrics sliced by horizon and by every categorical column — and the run's diagnostics cockpit lays them out:
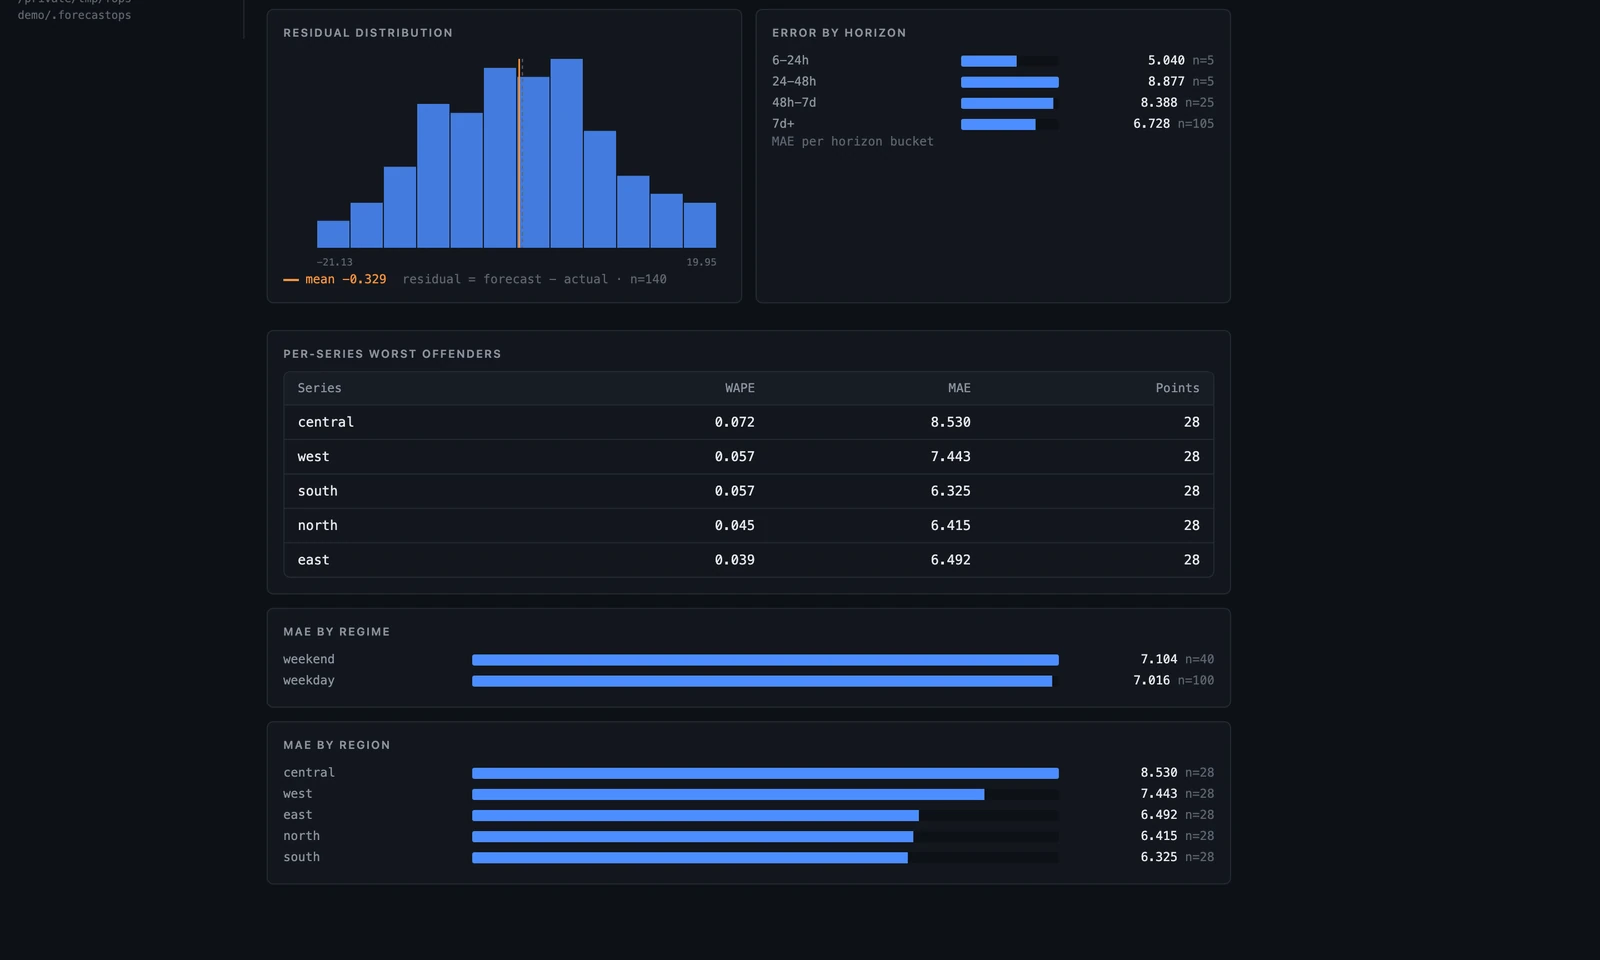
In one screen you can read the model's character. The residual distribution is roughly centered (mean −0.33 — no systematic bias). Error by horizon is flat-to-shrinking rather than blowing up at the long end. The central region is the worst offender at WAPE 7.2% while east sits at 3.9%, so if you were going to fine-tune or add a covariate, you now know where. Weekend error (7.10) runs a hair above weekday (7.02). None of this required a notebook — it's the default view of every run.
The same breakdown is available programmatically, which is what you want in a CI job or an agent:
result = fops.evaluate(forecast_with_actuals, slices=["horizon_bucket", "region", "regime"])
result.to_frame()   # tidy long-format: metric, value, horizon_bucket, slice, slice_value
ForecastOps computes MAE, RMSE, WAPE, sMAPE, bias, coverage, interval width, and — for quantile forecasts — pinball loss, each sliced however you ask.
#Is it actually good? Skill versus a benchmark
"MAE 7" is meaningless without a reference point. Because we passed a benchmark, ForecastOps computed skill — the fractional error reduction versus the seasonal-naive forecast. For this run, Chronos-2 beats "repeat last week" by 42% on MAE and WAPE and 55% on RMSE (the Skill column in the Runs view shows the RMSE figure, 0.55). That's the number that actually justifies running a foundation model instead of a one-liner, and now it's attached to every capture rather than living in someone's head.
You can also compare an already-captured run against a fresh benchmark from the CLI:
fops compare <run_id> --benchmark seasonal_naive.parquet --benchmark-name seasonal-naive
#Watch the trend, not just the snapshot
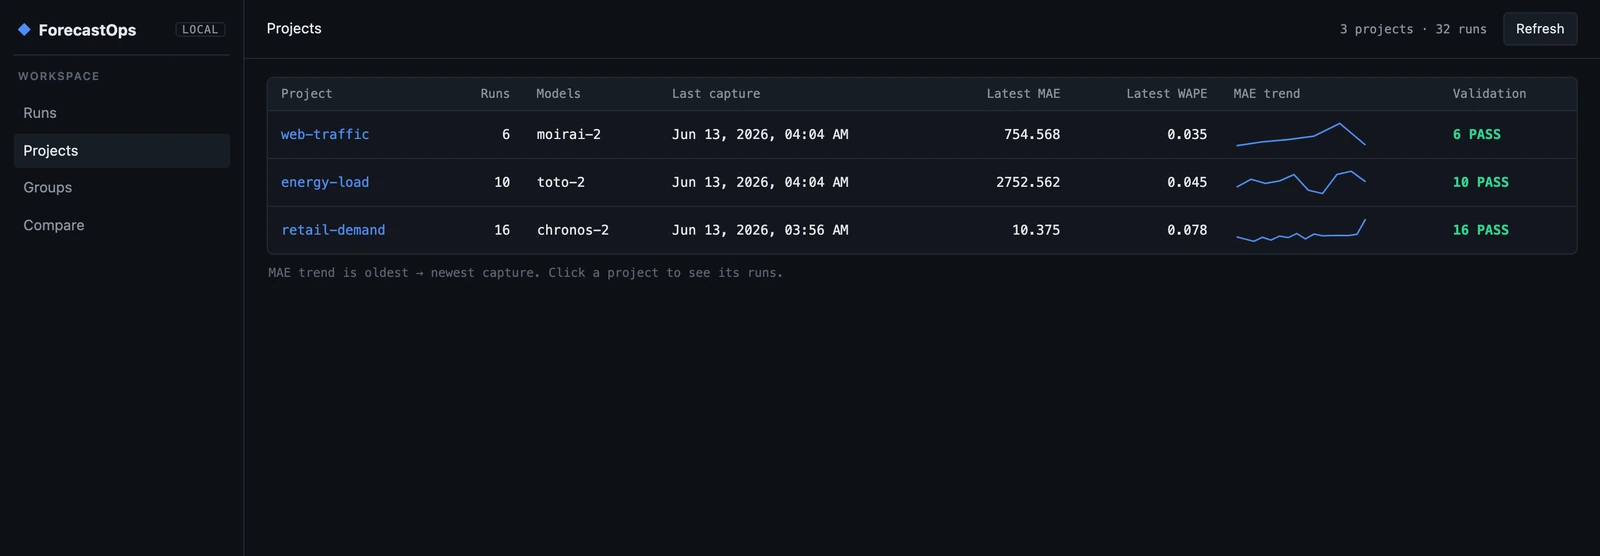
A forecast that was good last month can rot quietly as the world drifts away from the training distribution — the temporal-generalization problem that live benchmarks like Impermanent exist to study. The Projects view groups runs by project and plots the error trend across every capture, so drift shows up as a line going the wrong way long before it becomes an incident.
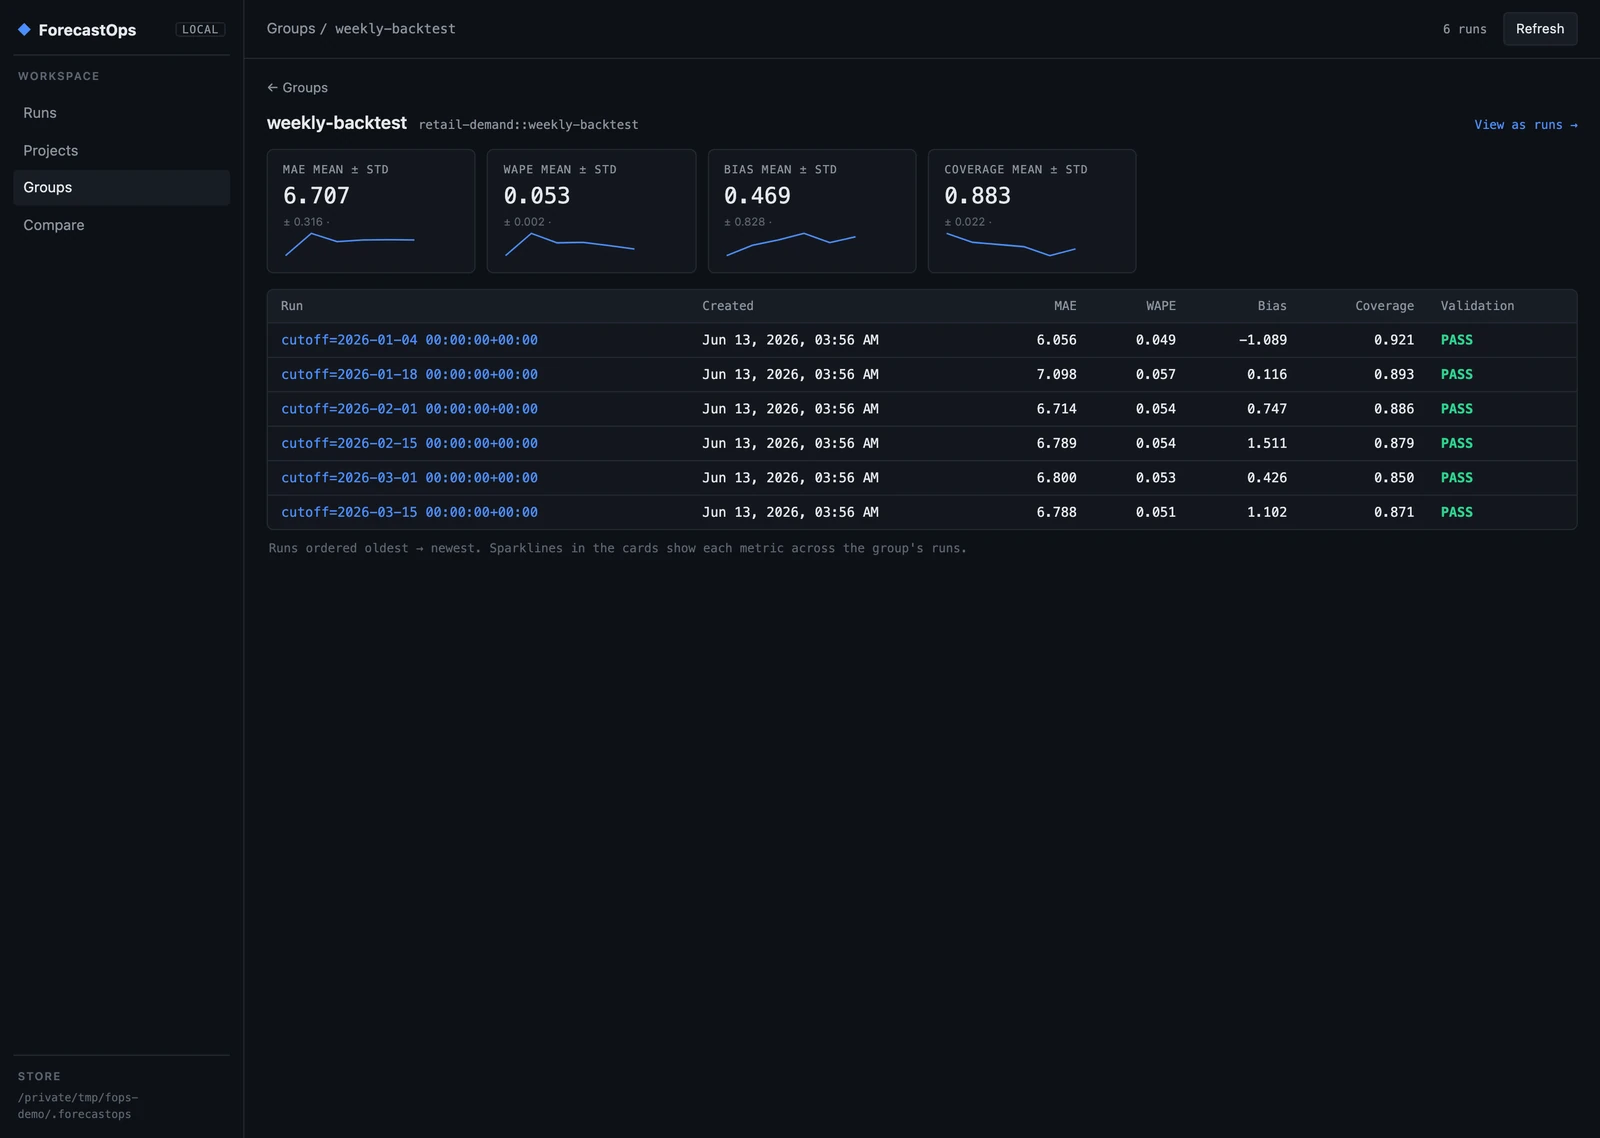
#Backtest as a first-class object
A point estimate of accuracy is fragile; you want the distribution across origins. ForecastOps treats a rolling-origin backtest as one grouped object. You produce the rolling forecasts with your own workflow — ForecastOps doesn't retrain anything — then hand it the panel with a cutoff column:
bt = fops.backtest(
    panel,                    # rolling-origin forecasts, tagged by a `cutoff` column
    group="weekly-backtest",
    project="retail-demand",
    schema=schema,
    actuals=actuals,
)
print(bt.aggregate)          # mean / std per metric across all windows
Each window becomes its own run, all sharing one group, and the group view reports mean ± std for every metric with a stability sparkline — so you can see at a glance not just that the model is accurate, but that it's consistently accurate.
#Catch regressions before they ship
This is where the whole exercise earns its keep. Say a new candidate model version, 2026.06-rc1, is ready and looks fine on a spot-check. Capture it and diff it against the incumbent:
fops diff <base_run_id> <candidate_run_id>
ForecastOps lines up every metric — overall and per slice — and flags the regressions:
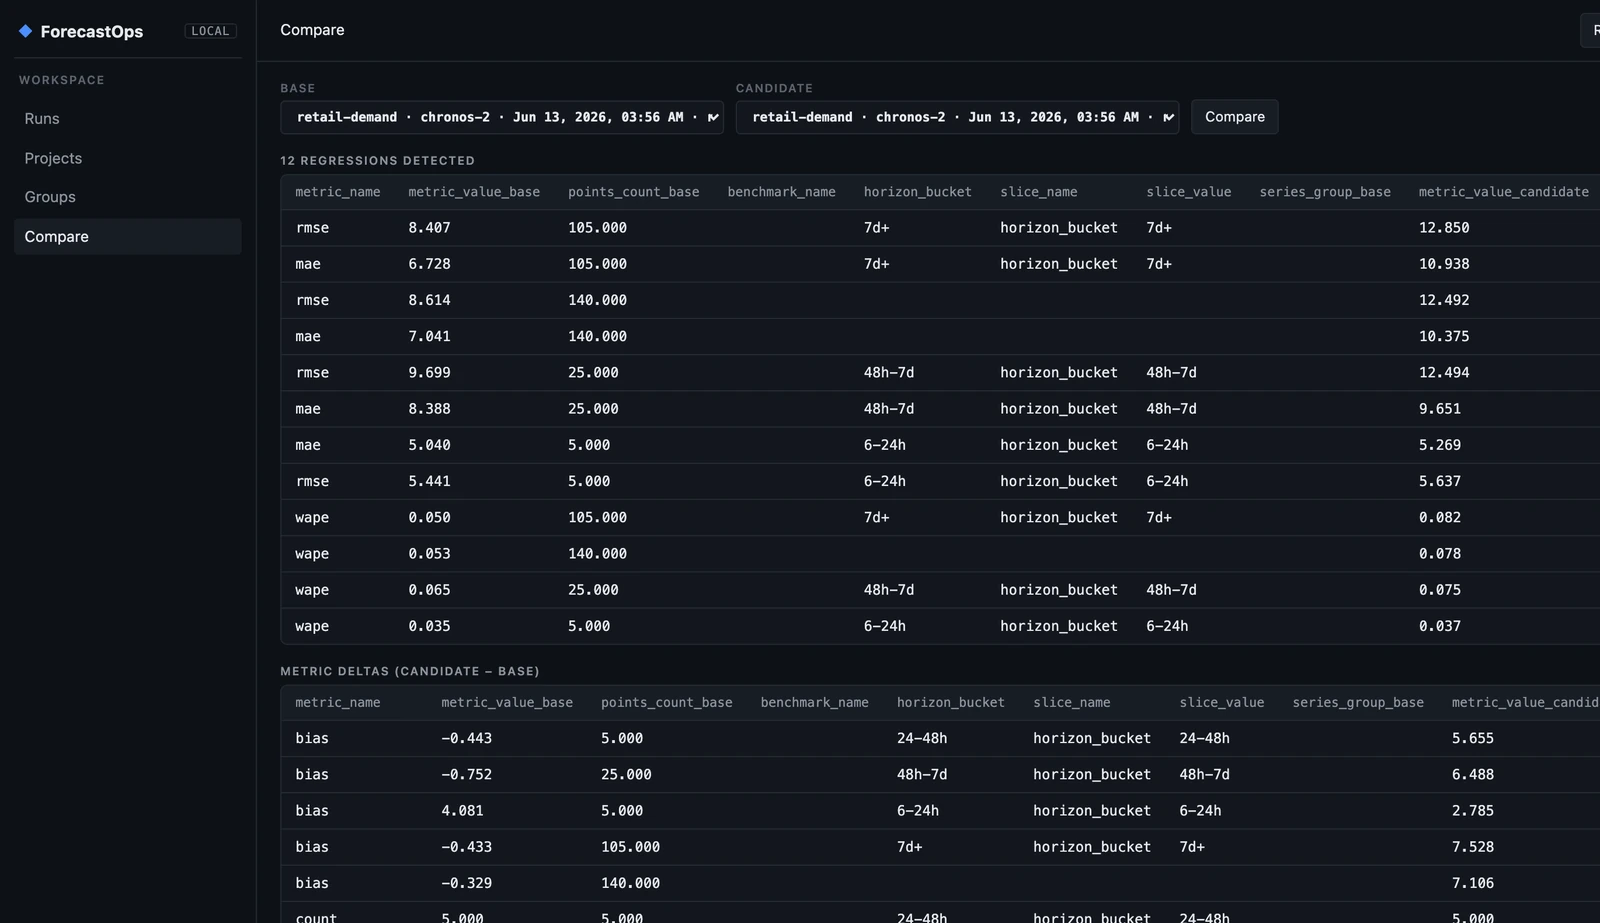
The candidate isn't subtly worse — it's a textbook regression, and the diff names every part of it. MAE, RMSE, and WAPE are up across every horizon bucket. A systematic +7 over-forecast bias has appeared (the base run's bias was −0.3). And the 90% interval coverage has collapsed from 86% to 66% — the intervals are now badly miscalibrated, the kind of break that a single aggregate MAE would hide completely. Twelve regressions, caught in one command, before any of it reached a dashboard.
#Built for agents and CI, not just eyeballs
The UI is for humans, but the most valuable surface in a modern stack is the machine-readable one. fops diagnose returns a structured verdict on a run — overall metrics, skill, the worst horizons, series, and regimes, validation status, and artifact URIs — which is exactly what a CI gate or an autonomous agent needs to make a decision:
fops diagnose <run_id>
{
  "run_id": "retail-demand-chronos-2-...",
  "overall": { "mae": 7.04, "wape": 0.053, "coverage": 0.864, "bias": -0.33 },
  "skill": { "skill_mae": 0.42, "skill_rmse": 0.55 },
  "worst_series": [{ "series_id": "central", "wape": 0.072, "mae": 8.53 }],
  "worst_regimes": [{ "slice": "regime", "value": "weekend", "wape": 0.018 }],
  "validation": { "status": "OK", "errors": [], "warnings": [] }
}
A few lines in your deploy pipeline — capture the candidate, diagnose it, fail the build if skill drops or coverage falls outside a band — and forecast quality becomes a gate instead of a postmortem.
#Local-first by default
ForecastOps is built so that putting forecasts under observation never means shipping them anywhere. By default it binds the UI to 127.0.0.1 and refuses other hosts unless you explicitly pass --allow-remote, makes no outbound network calls, stores raw forecast points only in your local store, and emits OpenTelemetry only when you turn it on — and never puts raw forecast points in telemetry. Your forecasts stay your forecasts.
The store itself is just a directory — .forecastops/forecastops.duckdb plus Parquet artifacts — so it commits, syncs, and inspects like any other local data.
#Where it fits with TSFM.ai
ForecastOps is the evaluation half of a TSFM workflow. TSFM.ai gives you the models — hosted, current, and benchmarked — and a playground to send your first forecast. ForecastOps is where the forecasts those models produce go to be measured: scored against a baseline, sliced until you understand them, backtested, diffed across versions, and gated in CI. Together they close the loop from "I can call a foundation model" to "I can trust this forecast in production and prove it."
Get started:
pip install forecastops
Then point it at a forecast you already produce, run fops ui, and see what your model has actually been doing. The project is open source and Apache-2.0 licensed at github.com/Parisi-Labs/forecastops — issues, adapters for your favorite library, and stars all welcome.
If you're building the model side of this loop, our guides on building production forecast pipelines, prediction intervals versus point forecasts, and model routing across TSFMs are good next reads.