Toto 2.0: Datadog Turns Observability Forecasting Into a Scaling Family
Datadog's Toto 2.0 release changes the Toto story from one 151M-parameter observability model into a scaling family. TSFM.ai hosts the full family from 4M up to the 2.5B frontier checkpoint, while the release adds u-muP scaling, alternating time/variate attention, and quantile forecasts.
Datadog's Toto started as a domain-specific time series foundation model for observability metrics: CPU, memory, network, request rates, error counts, latency percentiles, queue depths, and the messy multivariate telemetry streams that production systems emit continuously. The original open release was a single 151M-parameter model trained around the statistical shape of infrastructure metrics.
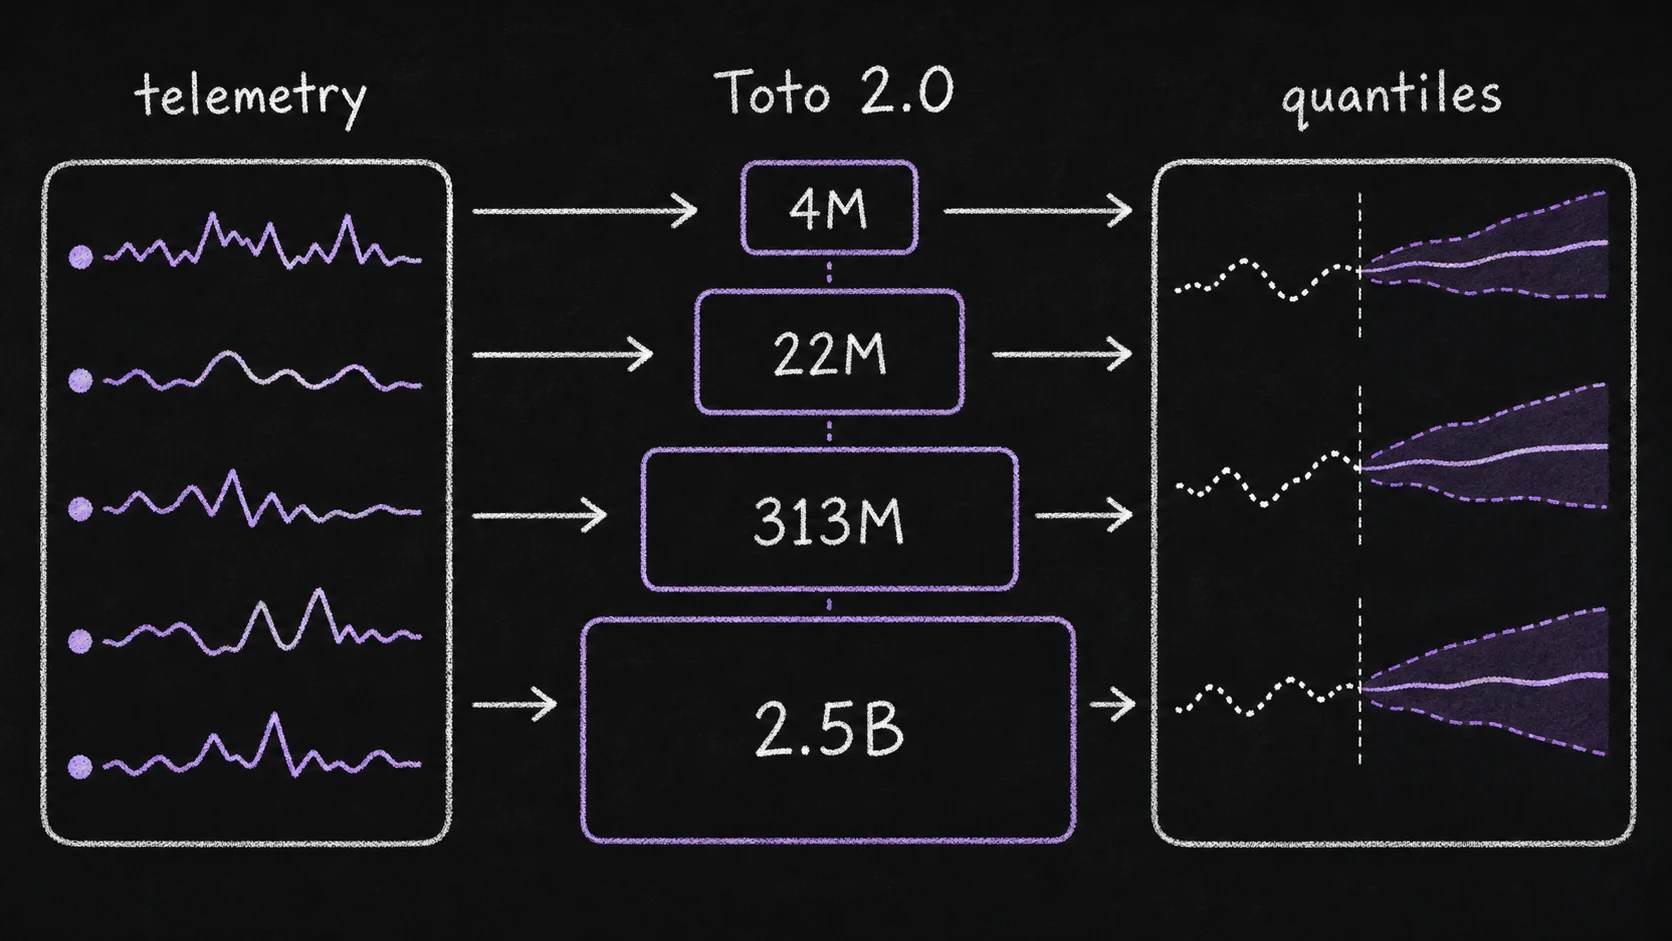
Toto 2.0 turns that into a family. The April 2026 upstream release ships five checkpoints - 4M, 22M, 313M, 1B, and 2.5B parameters - under one architecture line. TSFM.ai hosts the full family — 4M, 22M, 313M, 1B, and the 2.5B frontier checkpoint. That changes the deployment question from "Should we use Toto for observability?" to "Which hosted Toto scale fits this telemetry workload?"
The closest existing TSFM.ai posts are our original Toto overview, the BOOM benchmark deep dive, and the 2026 model-selection toolkit. This post is distinct because it focuses on what the 2.0 release changes: model scaling, output format, and the practical split between zero-shot inference today and fine-tuning support that remains in Toto 1.0.
#What Changed in Toto 2.0
The official repository describes Toto 2.0 as a "u-muP-scaled transformer with alternating time/variate attention and quantile-based probabilistic forecasting." Each part matters.
First, Toto is now a scaling family. The hosted 4M and 22M checkpoints make sense for fast experimentation, dashboards, and internal tooling where a smaller forecast model is easier to deploy broadly. The hosted 313M checkpoint is the likely middle ground for teams that want stronger zero-shot accuracy without the operational profile of billion-parameter inference. The hosted 1B checkpoint is for high-value telemetry groups where forecast quality can justify inference cost. The hosted 2.5B frontier checkpoint is the largest hosted Toto — for the highest-value telemetry and frontier zero-shot comparisons where forecast quality justifies the higher inference cost.
Second, the release uses u-muP scaling. In practice, this means Datadog is treating the model-size ladder as one coordinated architecture family rather than five unrelated training runs. The point of maximal-update-style scaling is to make hyperparameters transfer more predictably as width changes, reducing the amount of bespoke retuning needed at each size. For users, the benefit is not the acronym; it is that behavior should scale more smoothly from small to large checkpoints.
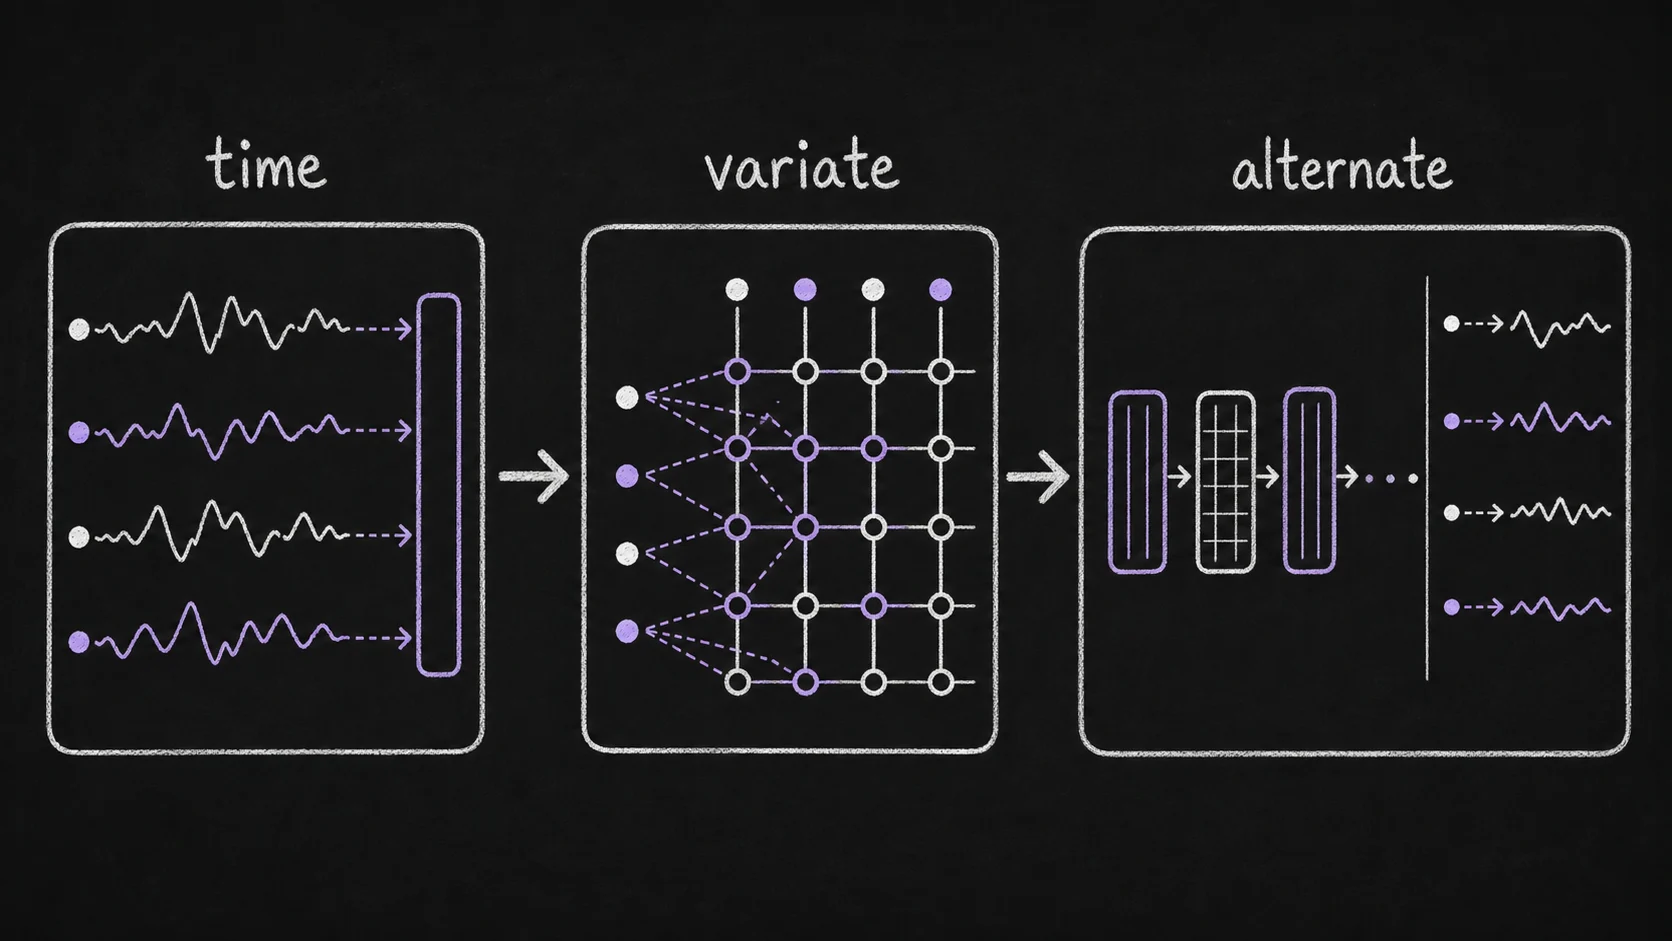
Third, 2.0 uses alternating time/variate attention. Toto 1.0 used proportional factorized variate-time attention to avoid the cost of full attention over every variable and every timestamp. The 2.0 README keeps the same conceptual direction: handle high-dimensional multivariate series by alternating between temporal structure and cross-variate structure rather than flattening everything into one enormous attention map. That is the right bias for observability, where a service's CPU, memory, request volume, latency, and error rate are related, but not every variable needs to attend to every timestamp in every other variable.
Fourth, probabilistic output moves to quantiles. Toto 1.0 used a Student-t mixture head, motivated by heavy-tailed observability metrics. Toto 2.0 returns quantiles directly - the README example emits nine levels from 0.1 through 0.9. For production users, quantiles are often the interface you actually want: p10/p50/p90 bands for capacity planning, dynamic alert thresholds, and SLO risk. This aligns Toto 2.0 more closely with the probabilistic interfaces used by Moirai 2.0 and other modern TSFMs.
#Why Observability Needs Its Own Scaling Story
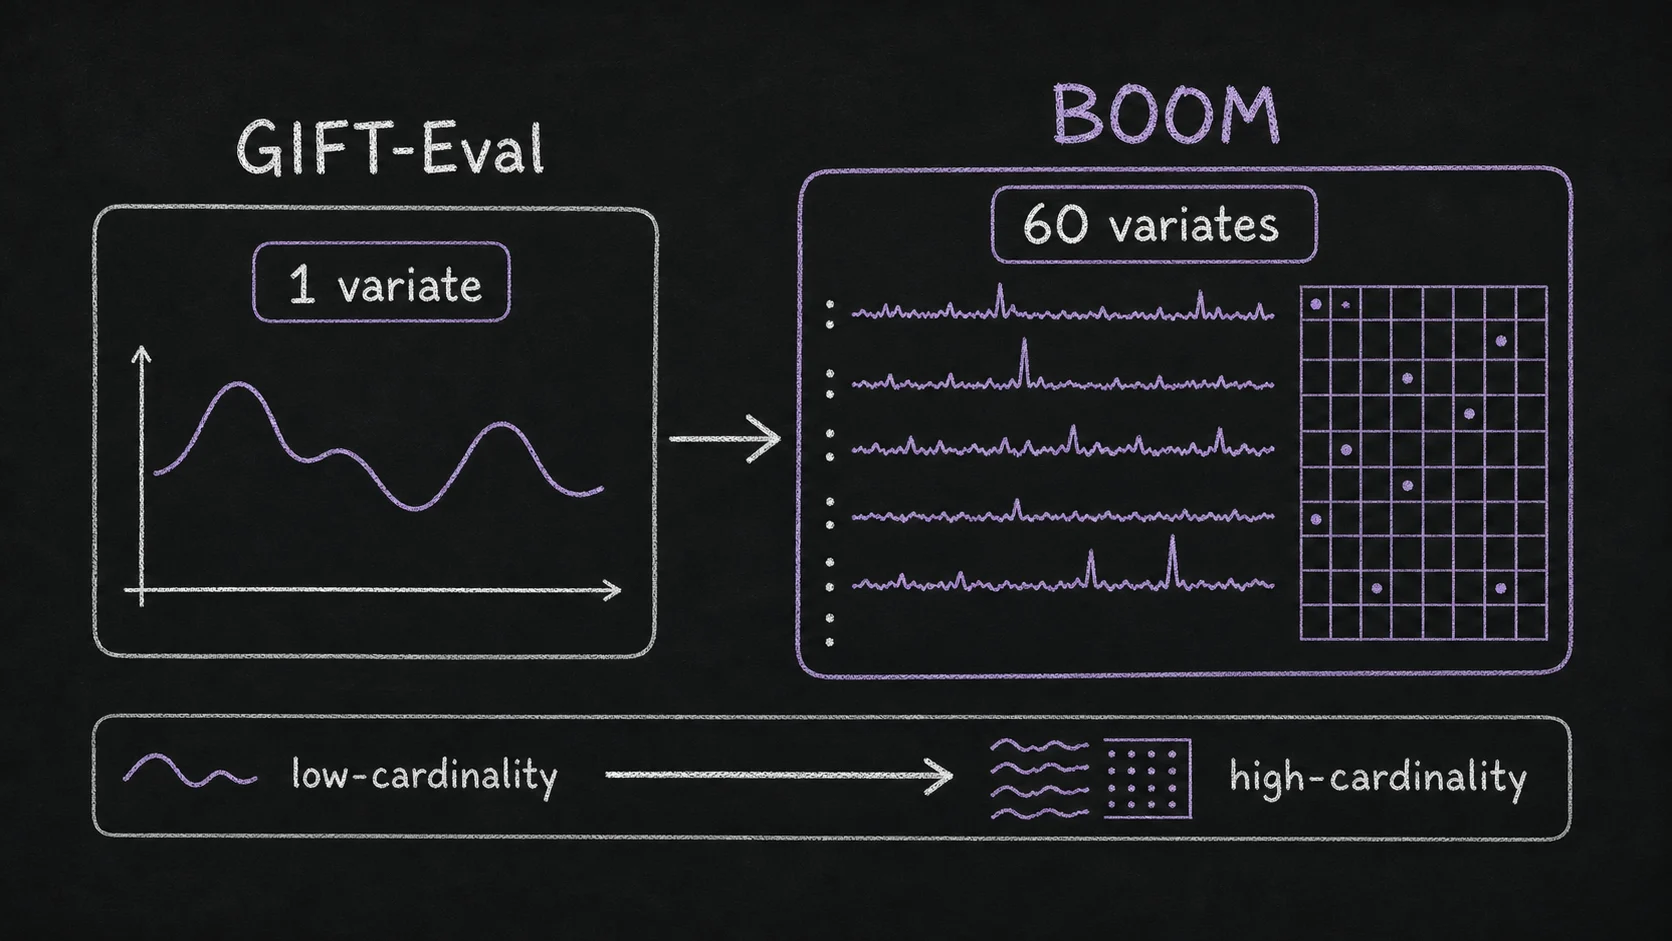
Observability is not just another univariate benchmark domain. The Toto 1.0 paper introduced BOOM, a benchmark with roughly 350 million observations across 2,807 metric queries. BOOM's median series has 60 variates; GIFT-Eval's median is one. That single number explains why general-purpose models can look strong on broad benchmarks and still struggle on infrastructure telemetry.
In observability, the hard cases are usually multivariate and operational:
- A request-rate forecast is less useful if it ignores concurrent error-rate and latency movement.
- A CPU forecast is easier to interpret when memory pressure and garbage-collection behavior are modeled with it.
- A disk-utilization forecast can be wrong in a specific, costly way if it misses batch jobs or compaction cycles.
- A p99 latency forecast needs heavy-tail awareness because the rare events are often the events operators care about most.
Toto 1.0's pretraining corpus was designed around this distribution. The paper reports approximately 2.36 trillion pretraining points, including 1.59 trillion anonymous Datadog internal observability metrics, plus public and synthetic data. BOOM then evaluates the same kind of workload in an open benchmark. Toto 2.0 inherits that domain framing but adds scale options.
#The Practical Model Choice
The upstream release's five checkpoints make Toto 2.0 feel less like one model and more like a deployment menu. TSFM.ai's hosted menu includes the first four at launch:
| Checkpoint | TSFM.ai status | Best first use | Practical read |
|---|---|---|---|
| Toto-2.0-4m | Hosted | Fast smoke tests, local evaluation, small dashboards | "Can this domain benefit from Toto at all?" |
| Toto-2.0-22m | Hosted | Low-latency operational forecasting | A plausible default for broad internal rollout |
| Toto-2.0-313m | Hosted | Accuracy-sensitive observability workloads | The likely serious-production candidate |
| Toto-2.0-1B | Hosted | High-value telemetry groups | Use where forecast quality pays for inference cost |
| Toto-2.0-2.5B | Hosted | Frontier zero-shot accuracy, high-value telemetry, upper-envelope comparisons | The largest hosted Toto; forecast quality justifies the higher inference cost |
The key is to evaluate on your own telemetry distribution. A smaller Toto model may beat a larger general-purpose model if the series look like BOOM: high-cardinality, irregular, sparse, bursty, and correlated across variables. A large Toto model may be unnecessary for simple univariate daily metrics where Chronos-Bolt, FlowState, or TTM already perform well at lower cost.
#The 2.0 Caveat: Fine-Tuning and Exogenous Variables
The 2.0 release is clearly positioned as the current recommended zero-shot release, but it is not a full replacement for every Toto 1.0 workflow. The repository notes that fine-tuning and exogenous-variable support are planned for a future 2.0 release but are not available yet. If you need those capabilities today, Datadog points users back to Toto 1.0.
That distinction matters for production forecasting architecture:
Use Toto 2.0 when the input is raw telemetry and the immediate need is zero-shot probabilistic forecasting. This fits dynamic thresholds, short-horizon capacity forecasts, and model comparisons where you do not want to maintain per-metric training jobs.
Use Toto 1.0 when the application depends on known future covariates or task-specific fine-tuning. Examples include maintenance calendars, deploy schedules, planned traffic events, or other operational metadata that the model should condition on explicitly.
Use model routing when observability is one slice of a broader workload. If the same platform forecasts infrastructure metrics, retail demand, energy load, and financial series, then Toto should be the observability specialist inside a routing layer, not necessarily the default for every input.
#Why the Quantile Interface Is a Product Shift
The move from a sample-heavy probabilistic interface to direct quantiles is not just cosmetic. Most observability workflows consume forecasts as thresholds and bands:
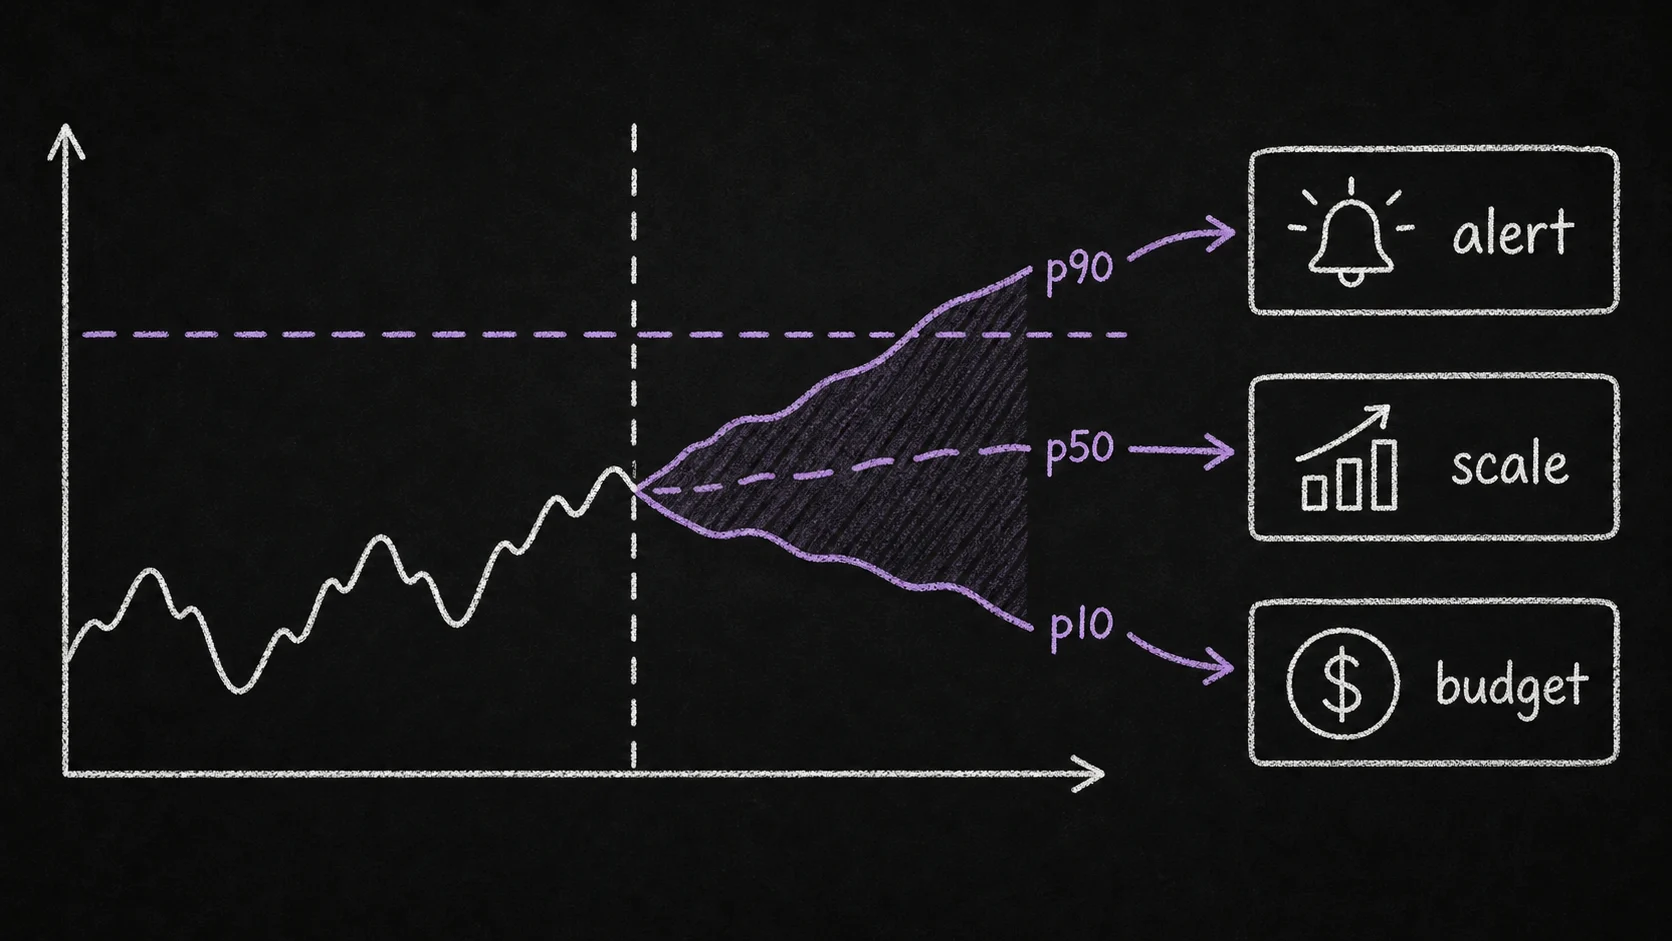
- p90 CPU utilization for capacity planning
- p10 request volume for underload detection
- p90 latency for early warning before SLO burn accelerates
- p50/p90 disk growth for storage procurement
Direct quantiles make those workflows easier to integrate. They also make Toto 2.0 easier to compare against other hosted TSFMs that expose prediction intervals through the same contract. In a model-router setting, this is important: every model can return a median forecast plus uncertainty bands, and downstream systems do not need to know whether the backend is Toto, Chronos, Moirai, TimesFM, or TTM.
The open question is calibration. Toto 1.0's Student-t mixture was explicitly motivated by heavy tails and outliers. Toto 2.0's quantile head is easier to consume, but users still need to measure whether the p90 band captures about 90% of outcomes on their own telemetry. For alerting, miscalibration is not an academic detail. Too-narrow intervals create noise; too-wide intervals hide incidents.
#What to Watch Next
Toto 2.0 is a signal that TSFM deployment is moving from single-checkpoint leaderboards to scalable model families. That is the same shift we have seen elsewhere: Moirai-MoE separates active and total parameters, IBM's March release splits the toolkit by task, and Toto now gives observability teams a size ladder.
Three things will determine how important the release becomes:
Scaling curves on BOOM and GIFT-Eval. The 2.0 README says Toto reaches top scores on BOOM and GIFT-Eval. The next thing practitioners need is a clear view of how much each size buys: where the 22M model saturates, where 313M becomes worth it, whether hosted 1B changes the answer for long-horizon telemetry, and what the hosted 2.5B frontier checkpoint adds for the most demanding telemetry and frontier comparisons.
Fine-tuning and exogenous-variable parity. Toto 1.0 remains necessary for teams that need those capabilities today. Once they arrive in 2.0, the new family becomes a much more complete production replacement.
Latency profiles under realistic multivariate loads. BOOM has high-dimensional series, and observability platforms care about throughput. The decisive production question is not just forecast accuracy; it is cost per metric group at the horizon and context length your alerting system actually uses.
The broader takeaway is simple: observability forecasting is becoming a first-class TSFM domain. Toto 1.0 proved that domain-specific pretraining matters. Toto 2.0 asks the next question: how much model do you need for the telemetry in front of you?
Primary sources: Datadog Toto repository, Toto 2.0 model collection, Toto 1.0 paper, BOOM dataset.